Customizing data tip location and behavior in a Flex LineChart
04 Aug 2010The Flex LineChart control has a feature to display pop-up “data tips” when the user hovers near a data point in the chart. These are basically just tooltips with information about the x and y values at the given point. Unfortunately, Flex offers little in the way of customizing when and how these data tips display. For example, the following is a LineChart using the horizontal-step style:
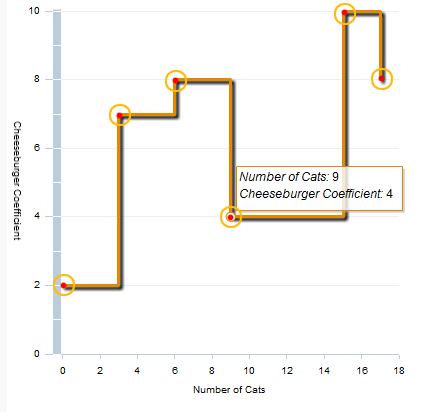
In a horizontal step chart, a line is drawn horizontally to the right of each data point, and vertically at each change in value. The circles around each data point indicate the area where hovering the mouse would produce a data tip. No other areas on the chart produce a data tip and this can be slightly confusing. The user might wonder why they can’t hover at other bends in the line to see the current value. Other users might want to simply hover anywhere along the line.
Solution
In order to gain control over how the LineChart decides where to show data tips, we will need to create a subclass of LineChart and override the findDataPoints function. This function is responsible for returning a list of data points “near” a given coordinate. We will change this to get the behavior we want.
public override function findDataPoints(x:Number, y:Number):Array {
   var result:Array = []; //array of HitData

   // Ignore mouse points outside of the data region of the chart. (e.g. on the axis labels)
   if (!dataRegion.contains(x, y)) {
      return result;
   }

   // The x,y coordinates given to findDataPoints are relative to the LineChart. Make them local to
   // the component which holds the data series
   var mouseLoc:Point = new Point(x - _seriesHolder.x, y - _seriesHolder.y);

   // Loop through each LineSeries displayed on the chart
   // This can also work with AreaSeries, etc. without too much modification
   for each (var line:LineSeries in this.series) {

      if (!line.visible) {
         continue;
      }

      // Get the value on the chart at the given mouse point
      var valueAtMouse:Array = line.localToData(mouseLoc);

      // Loop through the data points for this line and find the closest data point to the left of the mouse.
      // NOTE: This is specific to a "step" chart. For a regular "segment" chart, you'll need to find the 2
      // points on either side of the mouse and interpolate the value.
      var last:LineSeriesItem = null;
      for each (var item:LineSeriesItem in line.items) {
         if (item.xValue < valueAtMouse[0]) {
            last = item;
         }
         else {
            break;
         }
      }

      // If we found a data point and the line is within 50 pixels of the mouse vertically, we'll show a data tip
      // If you want to show data tips for ALL points at a specific x-value, just remove the vertical proximity check
      if (last && Math.abs(last.y - mouseLoc.y) < 50) {

         // We need to clone the data point that we found and modify its xValue to match that of our mouse
         // location. This way the popup data tip that displays will show the xValue at the mouse instead of
         // the nearest data point
         var hitPoint:LineSeriesItem = LineSeriesItem(last.clone());
         hitPoint.x = last.x;
         hitPoint.y = last.y;
         hitPoint.xValue = Math.floor(valueAtMouse[0]);
         hitPoint.yValue = last.yValue;

         // Compute the distance between the mouse and the data point.
         var dist:Number = Math.sqrt(Math.pow(mouseLoc.x - last.x, 2) + Math.pow(mouseLoc.y - last.y, 2));

         // Create a HitData object which the data tip will use. I ignore the ID param for now since I didn't
         // find it useful. If you need to implement it, see LineSeries.createDataID
         var hitData:HitData = new HitData(0, dist, x, hitPoint.y + _seriesHolder.y, hitPoint);

         // Make the data tip color scheme match the line. If you do anything fancy with your line coloring
         // you'll probably have to modify this.
         var stroke:SolidColorStroke = SolidColorStroke(line.getStyle('lineStroke'));
         hitData.contextColor = stroke.color;

         // Create the function which actually gives the text value for the data tip. Normally the LineSeries
         // constructs its own HitData objects and is responsible for supplying this function.
         hitData.dataTipFunction = makeDataTipFunction(line);

         result.push(hitData);
      }
   }

   return result;
}

protected function makeDataTipFunction(line:LineSeries):Function {

   // Create a data tip function for a given LineSeries. The code
   // below was copied almost exactly from LineSeries.formatDataTip
   return function(hd:HitData):String {
      var txt:String = "";

      var n:String = line.displayName;
      if (n && n != "") {
         txt += "<b>" + n + "</b><BR/>";
      }

      var xName:String = line.dataTransform.getAxis(CartesianTransform.HORIZONTAL_AXIS).displayName;

      if (xName != "") {
         txt += "<i>" + xName+ ":</i> ";
      }

      txt += line.dataTransform.getAxis(CartesianTransform.HORIZONTAL_AXIS).formatForScreen(
            LineSeriesItem(hd.chartItem).xValue) + "\n";

      var yName:String = line.dataTransform.getAxis(CartesianTransform.VERTICAL_AXIS).displayName;
      if (yName != "") {
         txt += "<i>" + yName + ":</i> ";
      }

      txt += line.dataTransform.getAxis(CartesianTransform.VERTICAL_AXIS).formatForScreen(
            LineSeriesItem(hd.chartItem).yValue) + "\n";

      return txt;
   }
}
Our new findDataPoints() finds the value of each line on the chart at the current mouse coordinates and returns and returns a HitData object for each value. The above code was written with step style LineCharts in mind, but can work with any style with a few modifications. The key is that you need to interpolate the value of each line at the mouse’s x-coordinate and use this value to display the data tip.
My code also only displays data tips for lines that are within 50 pixels of the mouse vertically. You can easily remove this check if you want to display tips for every line.