In ActionScript, the is operator can tell you whether a particular object is
an instance of a given class or interface, but how can you tell the relationship between
a Class itself and another Class or a Class and an interface?
This method can’t handle interfaces at all. Since getQualifiedSuperclassName only walks the class inheritance chain, it will never touch the interfaces of clsA. If clsB is an interface, this method will always return false. If clsA is an interface, this method will throw an error since getQualifiedSuperclassName returns null for interfaces.
This method eliminates the problems of the first 2 method, but at the cost of performance. describeType is an expensive method. It returns an XML document describing every aspect of a given object. If you are only running this check a few times, this cost is negligible, but for many calls it can add up quickly. describeType is also stupid; 2 successive requests to describe the same object will cause all the XML to be generated twice. If you know that you will be checking the same types many times, I strongly urge you to consider caching the description XML.
Performance Comparison
I set up a test with 25 random classes from the Flex API and used each method to compare every class to every other class (including themselves). I used the Flash Builder profiler to record time in each method.
Method
# of test runs
Cumulative time
Average cumulative time
Create an instance
1625
381 ms
0.23 ms
Use getQualifiedSuperclassName
1625
181 ms
0.11 ms
Use describeType
325
11391 ms (11027 ms of this spent running describeType)
35.05 ms
Use describeType with XML cached after first request
If you have a Flash Builder Standard license, chances are good that you’re lamenting the lack of FlexUnit support. You can run your tests from the command line but then you lose debugging and an integrated results display. You could add a second Application to your project to embed a test runner but due to an annoying bug in Flash Builder, this application file needs to be in your main source folder or else it can’t be added as a run configuration. I set out to find a new solution with the following in mind:
I want all test-related code to stay in the test sources folder. (src/test/flex since I’m using Maven)
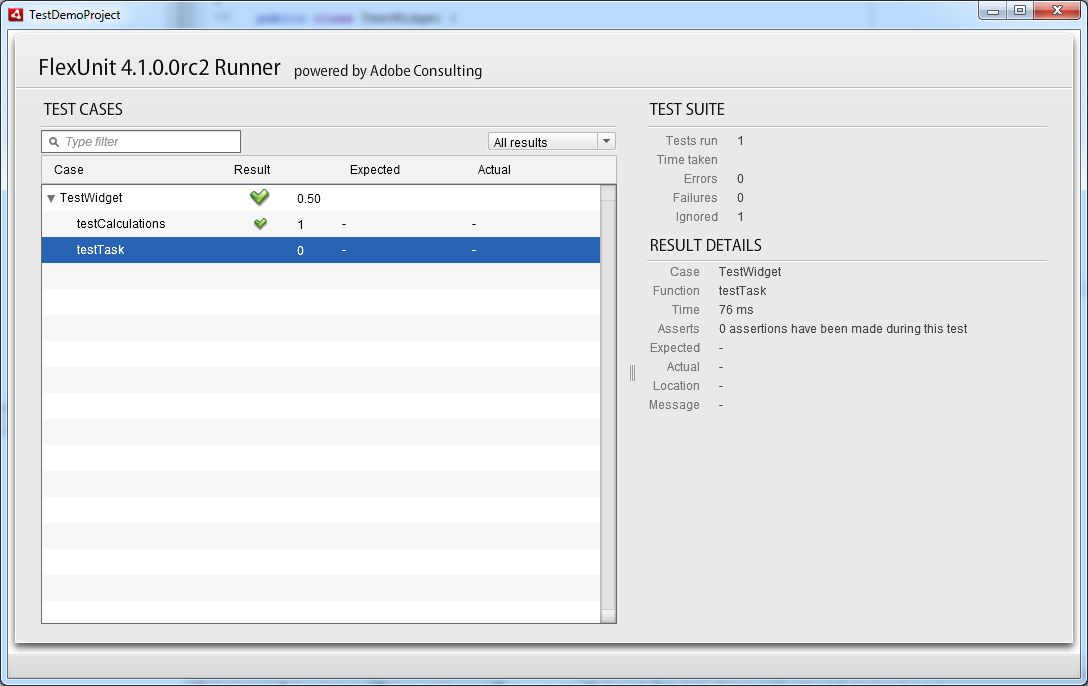
I want a visual test runner to display which tests/failed passed, give timing information, stack traces, etc.
The tests must work as-is when committed and run through flexmojos on a CI machine (e.g. Jenkins)
Debugging support through Flash Builder must be available when running the tests locally.
I managed to find a solution that satisfied all my criteria and wasn’t too messy. I’m sure there’s still room for improvement so please comment if you have any suggestions.
Main Project Structure
First, make sure that your test cases are in a separate source tree. Create a test suite that references the test cases you want to run:
Create a new MXML component that inherits from Sprite. I named mine DemoProjectTestModule. Declare a variable in this component of type Suite to force the compiler to include your test classes:
<mx:Spritexmlns:fx="http://ns.adobe.com/mxml/2009"xmlns:mx="library://ns.adobe.com/flex/mx"><fx:Script><![CDATA[
public var s:Suite;
]]></fx:Script></mx:Sprite>
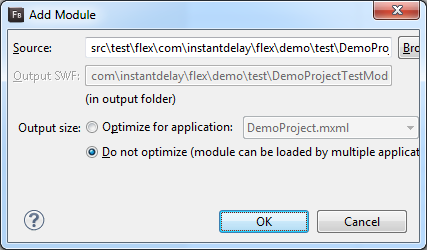
Now, edit your project properties and create a module from this component. Set it to “Do not optimize”. Flash builder will now create a SWF containing all your tests and any application classes they reference.
The Test Project
Create a new Flex project to hold the test running code. I made mine an AIR app so I could run it in a window and named it TestDemoProject.
In your test project properties, add a source folder pointing to the output directory of your main project which contains the test module SWF. (This will be a subdirectory of bin-debug.)
In the main MXML file for your test project, add the following:
This code is where the majority of the work happens. A Loader loads the SWF containing the tests and all your main application classes into the current domain (your test project.) When it finishes, we retrieve the test suite and run it.
And now you’re done! This test project only needs to be built once. When you change your main project the module containing the test cases will build and the test project loads that during runtime. Run the test project in debug mode and debugging support will be enabled.
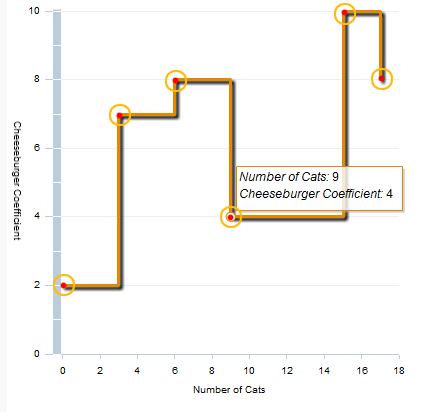
The Flex LineChart control has a feature to display pop-up “data tips” when the user hovers near a data point in the chart. These are basically just tooltips with information about the x and y values at the given point. Unfortunately, Flex offers little in the way of customizing when and how these data tips display. For example, the following is a LineChart using the horizontal-step style:
In a horizontal step chart, a line is drawn horizontally to the right of each data point, and vertically at each change in value. The circles around each data point indicate the area where hovering the mouse would produce a data tip. No other areas on the chart produce a data tip and this can be slightly confusing. The user might wonder why they can’t hover at other bends in the line to see the current value. Other users might want to simply hover anywhere along the line.
Solution
In order to gain control over how the LineChart decides where to show data tips, we will need to create a subclass of LineChart and override the findDataPoints function. This function is responsible for returning a list of data points “near” a given coordinate. We will change this to get the behavior we want.
publicoverridefunctionfindDataPoints(x:Number,y:Number):Array{varresult:Array=[];//array of HitData// Ignore mouse points outside of the data region of the chart. (e.g. on the axis labels)if(!dataRegion.contains(x,y)){returnresult;}// The x,y coordinates given to findDataPoints are relative to the LineChart. Make them local to// the component which holds the data seriesvarmouseLoc:Point=newPoint(x-_seriesHolder.x,y-_seriesHolder.y);// Loop through each LineSeries displayed on the chart// This can also work with AreaSeries, etc. without too much modificationforeach(varline:LineSeriesinthis.series){if(!line.visible){continue;}// Get the value on the chart at the given mouse pointvarvalueAtMouse:Array=line.localToData(mouseLoc);// Loop through the data points for this line and find the closest data point to the left of the mouse.// NOTE: This is specific to a "step" chart. For a regular "segment" chart, you'll need to find the 2 // points on either side of the mouse and interpolate the value.varlast:LineSeriesItem=null;foreach(varitem:LineSeriesIteminline.items){if(item.xValue<valueAtMouse[0]){last=item;}else{break;}}// If we found a data point and the line is within 50 pixels of the mouse vertically, we'll show a data tip// If you want to show data tips for ALL points at a specific x-value, just remove the vertical proximity checkif(last&&Math.abs(last.y-mouseLoc.y)<50){// We need to clone the data point that we found and modify its xValue to match that of our mouse// location. This way the popup data tip that displays will show the xValue at the mouse instead of// the nearest data pointvarhitPoint:LineSeriesItem=LineSeriesItem(last.clone());hitPoint.x=last.x;hitPoint.y=last.y;hitPoint.xValue=Math.floor(valueAtMouse[0]);hitPoint.yValue=last.yValue;// Compute the distance between the mouse and the data point.vardist:Number=Math.sqrt(Math.pow(mouseLoc.x-last.x,2)+Math.pow(mouseLoc.y-last.y,2));// Create a HitData object which the data tip will use. I ignore the ID param for now since I didn't// find it useful. If you need to implement it, see LineSeries.createDataIDvarhitData:HitData=newHitData(0,dist,x,hitPoint.y+_seriesHolder.y,hitPoint);// Make the data tip color scheme match the line. If you do anything fancy with your line coloring// you'll probably have to modify this.varstroke:SolidColorStroke=SolidColorStroke(line.getStyle('lineStroke'));hitData.contextColor=stroke.color;// Create the function which actually gives the text value for the data tip. Normally the LineSeries// constructs its own HitData objects and is responsible for supplying this function.hitData.dataTipFunction=makeDataTipFunction(line);result.push(hitData);}}returnresult;}protectedfunctionmakeDataTipFunction(line:LineSeries):Function{// Create a data tip function for a given LineSeries. The code// below was copied almost exactly from LineSeries.formatDataTipreturnfunction(hd:HitData):String{vartxt:String="";varn:String=line.displayName;if(n&&n!=""){txt+="<b>"+n+"</b><BR/>";}varxName:String=line.dataTransform.getAxis(CartesianTransform.HORIZONTAL_AXIS).displayName;if(xName!=""){txt+="<i>"+xName+":</i> ";}txt+=line.dataTransform.getAxis(CartesianTransform.HORIZONTAL_AXIS).formatForScreen(LineSeriesItem(hd.chartItem).xValue)+"\n";varyName:String=line.dataTransform.getAxis(CartesianTransform.VERTICAL_AXIS).displayName;if(yName!=""){txt+="<i>"+yName+":</i> ";}txt+=line.dataTransform.getAxis(CartesianTransform.VERTICAL_AXIS).formatForScreen(LineSeriesItem(hd.chartItem).yValue)+"\n";returntxt;}}
Our new findDataPoints() finds the value of each line on the chart at the current mouse coordinates and returns and returns a HitData object for each value. The above code was written with step style LineCharts in mind, but can work with any style with a few modifications. The key is that you need to interpolate the value of each line at the mouse’s x-coordinate and use this value to display the data tip.
My code also only displays data tips for lines that are within 50 pixels of the mouse vertically. You can easily remove this check if you want to display tips for every line.